I've been doing a bunch of reading over the past six months as I've made the transition from SoarTech where I was a bit of a jack-of-all-trades (project manager, proposal writer, programmer, designer, etc.) to ProModel where I am back to being primarily a visual and UX designer. As I've been reading, I've been collecting a list of good quotes about design. Thought I'd take the opportunity to share the best ones.
No design works unless it embodies ideas that are held common
by the people for whom the object is intended.
--Adrian Forty
Notation is a tool of thought.
A problem properly represented is largely solved.
-- Philosophy 101
Essentially, all models are wrong,
but some are useful.
-- George Box
The minimal requirement in design is
the organization of all the parts into a unified whole.
-- Eugene Larkin
Simple designs present the minimum amount of information
to achieve maximum effect ... by reducing and regularizing.
-- Michael Terry
Two golden rules of information visualization:
1) show the data, 2) show comparisons.
-- Bret Victor
A proper visualization is a kind of narrative,
providing a clear answer to a question without extraneous details.
-- Ben Fry
Make frequent tasks easy and infrequent tasks possible.
-- Usability Maxim
God is in the details.
-- Ludwig Mies van der Rohe
Wednesday, June 27, 2012
Friday, June 22, 2012
Script to Extend the Artboard in Adobe Illustrator
It's pretty easy to change the size of the artboard (i.e., canvas) in Adobe Illustrator, but as I've said in some previous posts I've started to experiment with large format wireframes / navigation diagrams. When you zoom way out (or print small) it looks like a navigation diagram, but you can zoom way in (or print poster size) to see the wireframe details. I'll put up an example in a later post.
Anyway, I tend to start with the artboard at tabloid (17x11) or 2x tabloid (34x22) and then grow the artboard incrementally as I go. I change the artboard regularly enough and in such a predictable way that I went ahead and made the script below:
----
if (documents.length == 0) {
alert("Must have a document open!");
}
TABLOID_LANDSCAPE_W = new UnitValue (17, "in");
TABLOID_LANDSCAPE_H = new UnitValue (11, "in");
curWidth = activeDocument.artboards[0].artboardRect[2];
curHeight = activeDocument.artboards[0].artboardRect[3];
isWidth = confirm("Extend width?");
if(isWidth) {
newWidth = curWidth + TABLOID_LANDSCAPE_W.as("px");
activeDocument.artboards[0].artboardRect = [0,0,newWidth,curHeight];
} else {
newHeight = curHeight -TABLOID_LANDSCAPE_H.as("px");
activeDocument.artboards[0].artboardRect = [0,0,curWidth,newHeight];
}
----
It's pretty simple, but I thought I might as well share the idea and the script for whomever might find it useful. Here's how it works:
- First check to make sure a document is open.
- Define the width and height that I'm going to use to extend the artboard.
- Get the current width and height of the artboard.
- I use a confirm dialog to ask if you want to extend the width, otherwise the script will extend the height.
- Finally, calculate the new width or height and extend the artboard.
Wednesday, June 20, 2012
Prezi in Adobe Illustrator. Part 1: Setting a Timer in Adobe Javascript
I've always really like poster-sized images in Illustrator for displaying site navigation diagrams. You can zoom out to get a "big picture" view and then zoom in on the details. Meng He shows a nice example of this in here Shindig Wireframe on Dribbble. To get the full effect, click on the PDF version and then use your pan and zoom tools to explore.
This kind of document navigation reminds me alot of Prezi, the non-linear presentation software that Brian Stensrud turned me onto. I've never used Prezi itself, but I've given presentations in that style (without the rotation). There are two free javascript libraries that I know of that do similar things, dizzy.js and impress.js.
The basic idea behind all of these tools is very simple. You define a sequence of frames on top of a large vector image and then use a script to navigate between them. I've written a rough Adobe Illustrator script that does this already. I'll upload the complete script in a later post.
One problem that I was having was animation. In my current script, the pan and zoom just jump around. This is fine, but you lose the context of the larger space, so I was looking for a way to do a simple linear animation between two zoom and pan states in Illustrator. In a browser, you can call setTimeout() to get a callback after a period of time, but that method doesn't exist in the Adobe Illustrator version of Javascript.
Luckily, I was found a great post on stackoverflow that provided the answer. Here's the code:
$.setTimeout = function(func, time) {
$.sleep(time);
func();
};
$.setTimeout(function () {alert("hello world")}, 3000);
UPDATE: After trying to get animation running in Illustrator in several different ways, I'm giving up on it. The Illustrator UI never updates until my script is finished. The "sleep" function below doesn't seem to work the way I thought it might. My next attempt will be to dump the SVG from Illustrator into an HTML 5 file and use dizzy.js or impress.js (see links above) to do the animation.
Sketchy Wireframes in Illustrator
I won't go into all of the reasons why it might be good to present hand-drawn concepts to customers and users early in the design process. It's a well-established idea and seems to work well for a number of people (for example, see articles by Dirk Weber and James Landay).
Personally, I also think it really looks cool (take a look at some great examples over on Dribbble) and, as Don Norman taught us, Attractive Things Work Better.
So all of this leads to a recent problem and solution that I'd like to share in this article. The problem is that I can't hand draw attractive concepts. I've never had the training and despite several attempts, I never seem to be able to put enough time into it -- work, family and life keep interfering.
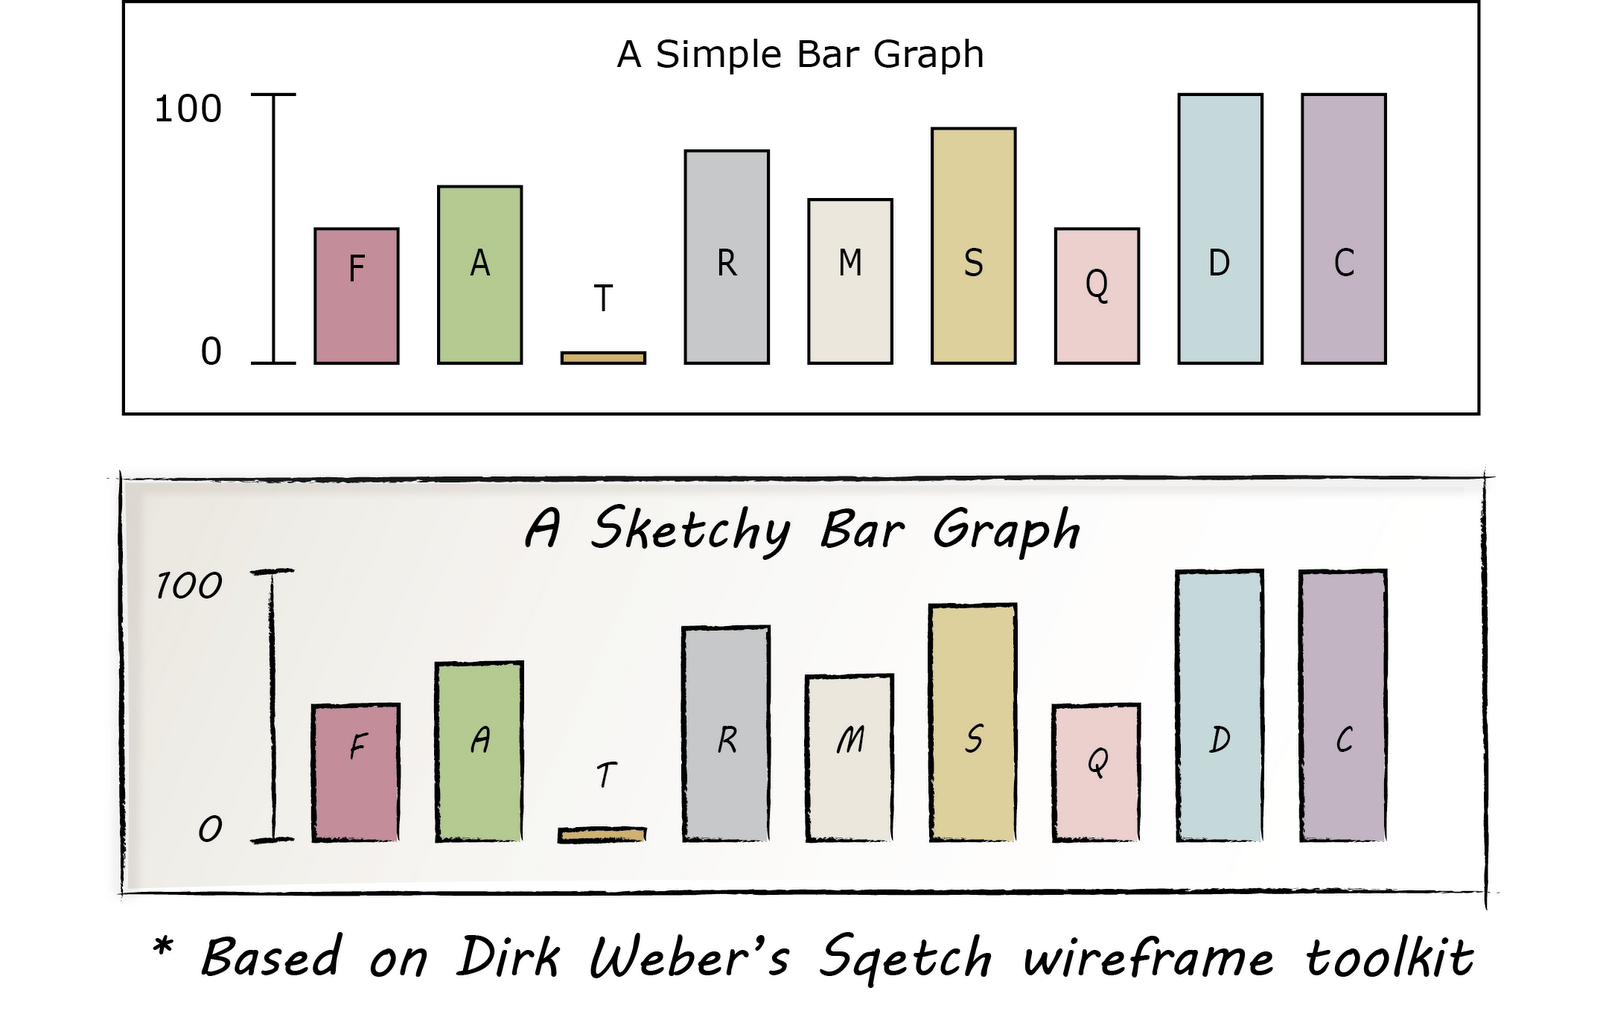
A solution came about as I was googling Illustrator wireframe toolkit and found Sqetch. As you can see below, it can be used to create attractive, sketchy wireframes.

Sqetch has a couple of problems from my perspective. The first is that it loads very slowly. See all of those textured backgrounds? My laptop takes its time rendering them. That makes it not fun for rapid prototyping. The second problem is that it almost looks too good for initial prototypes.
However, there are some things that I learned from the toolkit.

UPDATE: Found a nice tutorial that shows how to make any font look sketchy. The tutorial is for fonts, but you could use this anywhere you want a rough "crosshatch" fill. The secret is to use the "scribble" effect on the fill and the "roughen" effect on the stroke from the Appearance panel. Here are the specific settings they use on those effects:

Personally, I also think it really looks cool (take a look at some great examples over on Dribbble) and, as Don Norman taught us, Attractive Things Work Better.
So all of this leads to a recent problem and solution that I'd like to share in this article. The problem is that I can't hand draw attractive concepts. I've never had the training and despite several attempts, I never seem to be able to put enough time into it -- work, family and life keep interfering.
A solution came about as I was googling Illustrator wireframe toolkit and found Sqetch. As you can see below, it can be used to create attractive, sketchy wireframes.

Sqetch has a couple of problems from my perspective. The first is that it loads very slowly. See all of those textured backgrounds? My laptop takes its time rendering them. That makes it not fun for rapid prototyping. The second problem is that it almost looks too good for initial prototypes.
However, there are some things that I learned from the toolkit.
- You can make any path look like pencil in illustrator by using the right sketchy brush.
- If you do that and turn your rectangles into four slightly overlapping lines, it you get that "hand drafted" style.
- Use a hand drawn font. Sqetch uses a font called Nymph's Handwriting, but Microsoft has some built in that work just fine. I'm using MV Boli right now. Segoe Print is also good. Also, the Google Webfonts project has a nice one called Delius.
- With care, you can use gradients, transparency and brushes if you want some of the textures that you see above.
- You can save UI elements (buttons, text fields, etc.) in Adobe Illustrator as Symbols for rapid reuse.
UPDATE: Found a nice tutorial that shows how to make any font look sketchy. The tutorial is for fonts, but you could use this anywhere you want a rough "crosshatch" fill. The secret is to use the "scribble" effect on the fill and the "roughen" effect on the stroke from the Appearance panel. Here are the specific settings they use on those effects:
- Scribble: Angle to 45, the Path Overlap to 0 px, the Path Overlap Variation to 2 px, the Stroke Width to 1 px, the Curviness to 0, the Curviness Variation to 50, the Spacing to 2 px, and the Spacing Variation to 1.5 px
- Roughen: Size to .5, select the Relative radial button, change the Detail to 30, and select the Smooth radial button for Point

Monday, June 11, 2012
2012 Status Update or Prelude to Adobe Illustrator Scripting Posts
I've been learning a few things recently about Adobe Illustrator (specifically its scripting capabilities) that don't seem to be widely available on the internet. That made me think that I should probably go ahead and write some blog posts. Hopefully, they can save the next guy a bit of time, or at least I'll be able to find the information the next time I need it.
Looks like it's been almost 2 years since I've posted. Hard to believe it's been that long. Here's a little background information about me -- things have changed a bit and this may help folks know where these posts are coming from.
I left Soar Technology last November and started working for a company called ProModel. The companies are similar in many ways -- small businesses, offices in Ann Arbor and other places, focus on software, computer science and AI. The main difference is that SoarTech is primarily a research company while ProModel is primarly a product company (with some overlap for each). For me this means less project managment and proposal writing (which I did enjoy and do miss a bit) and more interaction with end users and more pure user experience design. My new title is User Experience Designer, although they also refer to me as a Business Analyst. I've always thought that there is a lot of overlap between these two jobs -- especially for end-user systems.
Anyway, as I said above, my next series of posts will be about scripting Adobe Illustrator. If you've read my previous posts, such as JHotDraw and Semantic Wikis, you might understand that I'm really interested in pushing the boundaries of interacting with visual data. I really enjoy working with Adobe Illustrator, but I have some ideas about how I can take it to the next level in terms of producing interactive, sematically-rich visualizations. Stay tuned...
Subscribe to:
Comments (Atom)
